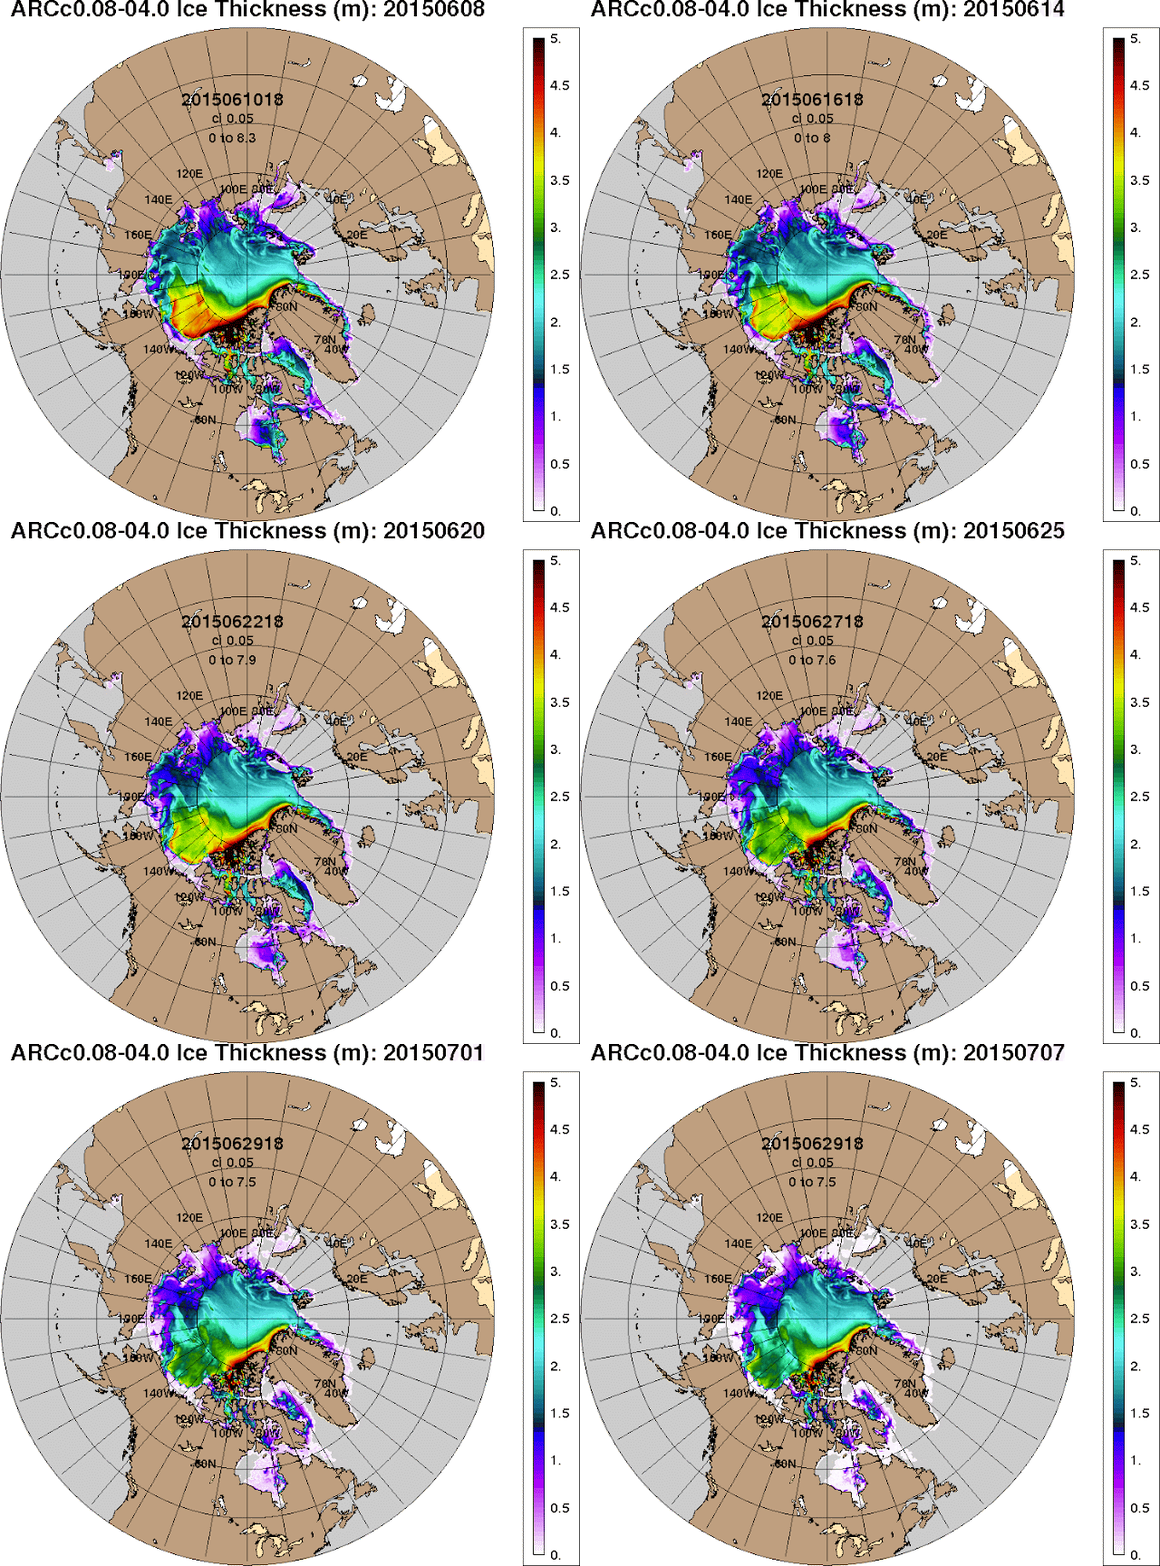
The 30-day animation below further illustrates this dramatic fall in sea ice thickness (from June 8-29, with forecast up to July 7, 2015).
Another perspective is sea ice concentration. The image below shows the high concentration back on May 1, 2015.
The 30-day animation below shows the dramatic fall in sea ice concentration (from June 8-29, with forecast up to July 7, 2015).
Below an interview by Judy Sole with Professor Peter Wadhams, held May 15, 2015, and entitled 'Our time is running out - The Arctic sea ice is going!'
Meanwhile, very high temperatures keep showing up within the Arctic Circle. On July 1, 2015, a temperature of 36°C (96.8°F) was reached near the Kolyma River that ends in the East Siberian Sea, as illustrated by the images below (green circle).
The image below also shows the location where this high temperature was reached (red marker), as well as the depth of the seabed and the Gakkel Ridge that runs in between the northern tip of Greenland and the Laptev Sea.
Related
- High Methane Levels over Laptev Sea
http://arctic-news.blogspot.com/2013/10/high-methane-levels-over-laptev-sea.html
- Accelerated Warming in the Arctic
http://arctic-news.blogspot.com/2015/06/accelerated-warming-in-the-arctic.html
- Gulf Stream brings ever warmer water into Arctic Ocean
http://arctic-news.blogspot.com/2015/06/gulf-stream-brings-ever-warmer-water-into-arctic-ocean.html
- High Temperatures in the Arctic
http://arctic-news.blogspot.com/2015/06/high-temperatures-in-the-arctic.html
- Heat Wave Forecast For Russia Early June 2015
http://arctic-news.blogspot.com/2015/06/heat-wave-forecast-for-russia-early-june-2015.html
Dramatic Sea Ice Decline In Beaufort Sea in June 2015 http://arctic-news.blogspot.com/2015/06/dramatic-sea-ice-decline-in-beaufort-sea-in-june-2015.html
Posted by Sam Carana on Tuesday, June 30, 2015


0 komentar:
Posting Komentar