This is default featured slide 1 title

Go to Blogger edit html and find these sentences.Now replace these sentences with your own descriptions.This theme is Bloggerized by Lasantha Bandara - Premiumbloggertemplates.com.

This is default featured slide 2 title

Go to Blogger edit html and find these sentences.Now replace these sentences with your own descriptions.This theme is Bloggerized by Lasantha Bandara - Premiumbloggertemplates.com.

This is default featured slide 3 title

Go to Blogger edit html and find these sentences.Now replace these sentences with your own descriptions.This theme is Bloggerized by Lasantha Bandara - Premiumbloggertemplates.com.

This is default featured slide 4 title

Go to Blogger edit html and find these sentences.Now replace these sentences with your own descriptions.This theme is Bloggerized by Lasantha Bandara - Premiumbloggertemplates.com.

This is default featured slide 5 title

Go to Blogger edit html and find these sentences.Now replace these sentences with your own descriptions.This theme is Bloggerized by Lasantha Bandara - Premiumbloggertemplates.com.

Tampilkan postingan dengan label runaway. Tampilkan semua postingan

Minggu, 20 September 2015

August 2015 Had Highest Sea Surface Temperature on Record

Across the oceans, the August 2015 globally-averaged sea surface temperature was 0.78°C (1.40°F) above the 20th century average—the highest temperature for any month in the 1880–2015 record. NOAA analysis further shows that in August 2015, the sea surface on the Northern Hemisphere was 1.02°C (1.84°F) warmer than it was in the 20th century, as illustrated by the graph below.


As the image below shows, the August data for sea surface temperature anomalies on the Northern Hemisphere contain a trendline pointing at a rise of 2°C (3.6°F) well before the year 2030. In other words, if this trend continues, the Northern Hemisphere sea surface will be 2°C (3.6°F) warmer in about a dozen years time from now.


Such a temperature rise would be catastrophic, as there are huge amounts of methane contained in the form of hydrates and free gas in sediments under the Arctic Ocean seafloor. A relatively small temperature rise of part of these sediments could cause a huge abrupt methane eruption, further speeding up local warming and triggering further methane eruptions, in a spiral of runaway warming that will cause mass destruction and extinction, as described in the reference page The Mechanism.

The situation is dire and calls for comprehensive and effective action, as discussed at the Climate Plan page.


August data for sea surface temperature anomalies on the Northern Hemisphere contain a trendline pointing at a rise of 2...

Posted by Sam Carana on Sunday, September 20, 2015

Minggu, 19 Juli 2015

Arctic Sea Ice Collapse Threatens - Update 1

The image below compares the Arctic sea ice thickness (in m) on July 15, for the years from 2012 (left panel) to 2015 (right panel), using Naval Research Laboratory images.

Click on image to enlarge
The image below compares the Arctic sea ice concentration (in %) on July 18, for the years from 2012 (left panel) to 2015 (right panel), using Naval Research Laboratory images.


Above images show the dramatic decline of the sea ice in 2015, both in thickness and in concentration.

In terms of thickness, sea ice has been reduced by more than one meter in many places, such as north of Greenland and the Canadian Archipelago, all in the time span of just one month.

The dramatic fall in sea ice concentration also becomes apparent when comparing recent sea ice concentration (July 18, 2015, above right) with sea ice concentration back in May 2015 (image right, May 1, 2015).

This dramatic decline of the sea ice in 2015 is the result of a combination of factors, including:

  1. High levels of greenhouse gases over the Arctic Ocean, as illustrated by the image below, showing that on July 17, 2015 (pm), levels as high as 2512 parts per billion were recorded at 6,041 m (19,820 ft) altitude, while mean methane levels were 1830 parts per billion at this altitude.
  2. High levels of ocean heat, as illustrated by the image below showing high sea surface temperatures off the east coast of North America; much of this ocean heat will be carried by the Gulf Stream into the Arctic Ocean over the next few months.
  3. High air temperatures over North America and Siberia extending over the Arctic Ocean, as illustrated by the image below showing a temperature of 23.1°C (73.7°F), recorded on July 19, 2015, at Banks Island, in the Canadian Archipelago (green circle).
  4. Wildfires triggered by these heatwaves resulting in darkening compounds settling on snow and ice, as illustrated by the image below showing smoke covering a wide area on July 19, 2015, from the east Siberia over North America to the southern tip of Greenland.
  5. Very warm river water running into the Arctic Ocean, as illustrated by the image below, showing sea surface temperatures as high as 19°C (66.2°F) off the coast of Alaska on July 12-15, 2015.
The image below shows the already very high sea surface temperature anomalies as at July 18, 2015.

The Climate Reanalyzer image below shows the high sea surface temperature anomalies in the Pacific Ocean, and where water enter the Arctic Ocean through the Bering Strait, on July 19, 2015.


With still two months of melting to go before the sea ice can be expected to reach its minimum for 2015, the threat of sea ice collapse is ominous. The Arctic-News Blog has been warning for years about the growing chance of a collapse of the sea ice, in which case huge amounts of sunlight that previously were reflected back into space, as well as heat that previously went into melting the ice, will then instead have to be absorbed by the water, resulting in a dramatic rise of sea surface temperatures.

More open water will then come with an increased chance of storms that can cause high sea surface temperatures to be mixed down all the way to seafloor of the Arctic Ocean, which in many cases is less than 50 m (164 ft) deep. This is the case for the East Siberian Arctic Shelf, where experts estimate that huge amounts of methane are contained in subsea sediments. Already now, sea surface temperatures as high as 10°C (~50°F) are recorded there, as illustrated by the image below.


Massive amounts of ocean heat will be carried by the Gulf Stream into the Arctic Ocean over the next few months. The combined result of high sea surface temperatures being mixed down to the seafloor and the ocean heat entering the Arctic Ocean from the Atlantic and Pacific Oceans can be expected to result in dramatic methane eruptions from the Arctic Ocean seafloor by October 2015.

The situation is dire and calls for comprehensive and effective action, as discussed at the Climate Plan.


Arctic sea ice thickness on July 15, compared over the years 2012 through to 2015. Already virtually all the thick sea...

Posted by Sam Carana on Thursday, July 16, 2015

Minggu, 01 Februari 2015

WARNING - Planetary Omnicide between 2023 and 2031

[ click on image to enlarge or view this image ]

Below is a table using the ice core gradients for a continuously pulsing clathrate gun and one where the methane clathrate pulse decays over time from the data on the poster.

[ click on image to enlarge or view this image ]


References and Further Reading

- State Of Extreme Emergency, by Malcolm P.R. Light

- Focus on Methane, by Malcolm P.R. Light
http://arctic-news.blogspot.com/2014/07/focus-on-methane.html

- Arctic Atmospheric Methane Global Warming Veil, by Malcolm P.R. LightHarold Hensel and Sam Carana


Rabu, 19 Februari 2014

High methane levels over the Arctic Ocean on February 17, 2014


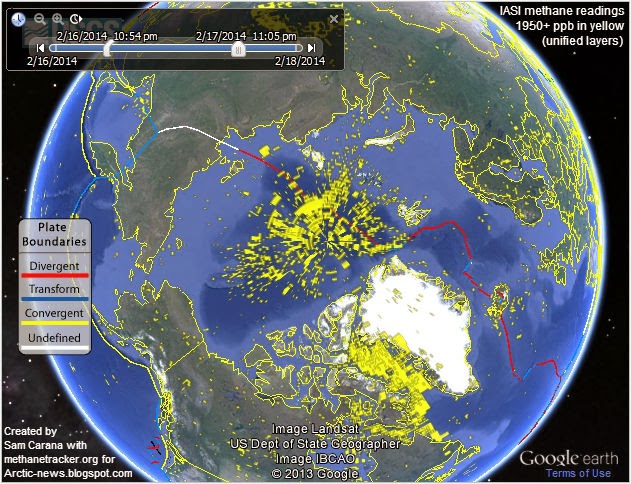
Above image shows IASI methane readings over the last day or so, when levels as high as 2223 ppb were recorded.

Where does the methane come from?

On above image, methane shows up prominently along the faultline that crosses the Arctic Ocean from the northern tip of Greenland to the Laptev Sea. This indicates that the methane originated from the depths of the Arctic Ocean, where sediments contain large amounts of methane in the form of free gas and hydrates, which have become destabilized.

High methane concentrations have persistently shown up over the Arctic Ocean since October 1, 2013. On January 19, 2014, levels as high as 2363 ppb were recorded over the Arctic Ocean, as illustrated by the image below, from an earlier post.

[ from earlier post, click on image to enlarge ]
Below is a comparison of methane readings for the week from February 9 to 16, 2014, compared to the same period in 2013.

[ from earlier post, click on image to enlarge ]
The above comparison shows that there is a lot of methane over the Arctic Ocean that wasn't there last year. 

Furthermore, high methane readings show up where currents move the sea ice out of the Arctic Ocean, in areas such as Baffin Bay. This indicates that methane that is released from the seafloor of the Arctic Ocean appears to be moving underneath the ice along with exit currents and entering the atmosphere where the sea ice is fractured or thin enough to allow the methane to pass through. 

Also note that more orange areas show up on the southern hemisphere in 2014, indicating that more methane from the northern hemisphere is now spreading south beyond the equator. This in addition to indications that more methane is rising and building up at higher altitudes, as discussed in an earlier post.

Causes

What made these high releases from the seafloor of the Arctic Ocean persist for so long? At this time of year, one might have thought that the water in the Arctic Ocean would be much colder than it was, say, on October 1, 2013.

Actually, as the combination image below shows, sea surface temperatures have not fallen much at the center of the Arctic Ocean between early October, 2013 (left) and February 17, 2014 (right). In the area where these high methane concentrations occured, sea surface temperatures have remained the same, at about zero degrees Celsius.

[ click on image to enlarge ]
The above comparison image shows that, while surface temperatures in the Atlantic Ocean may have fallen strongly with the change of seasons, surface temperatures in the Arctic Ocean have changed only little.

In this case of course, what matters more than surface temperatures are water temperatures at greater depth. Yet, even here temperatures in the Arctic Ocean will have decreased only slightly (if at all) compared to early October 2013, since the Gulf Stream has continued to push warmer water into the Arctic, i.e. water warmer than the water in the Arctic Ocean, so the heating impact of the Gulf Stream continues. Also, sea surface temperature anomalies along the path of the Gulf Stream continue to be anomalously high, as the image below shows.


The situation looks even more grim on the Climate Reanalyzer image below, showing sea surface temperature anomalies that are far more profound in the Arctic Ocean.


Note also that, as the sea ice extent increased, there have been less opportunities for the heat to evaporate on the surface and for heat to be transferred from the Arctic Ocean to the air.

Finally, what matters a lot is salinity. The combination image below compares salinity levels between October 1, 2013 (left), and February 17, 2014 (right).

[ click on image to enlarge ]
Salinity levels were low on October 1, 2013, as a lot of ice and snow had melted in the northern summer and rivers had carried a lot of fresh water into the Arctic Ocean. After October 1, 2013, little or no melting took place, yet the Gulf Stream continued to carry waters with higher salt levels from the Atlantic Ocean into the Arctic Ocean.

Annual mean sea surface salinity
Seawater typically has a salinity level of over 3%; it freezes and melts at about −2°C (28°F). Where more saline water from the Atlantic Ocean flows into the Arctic Ocean, the water in the Arctic Ocean becomes more saline. The freezing and melting point of fresh water (i.e. zero salinity) is 0°C (or 32°F). More salinity makes frozen water more prone to melting, i.e. at temperatures lower than 0°C, or as low as −2°C.

As the salinity levels of the water on the seafloor of the Arctic Ocean increased, the ice that had until then held the methane captive in hydrates on the seafloor of the Arctic Ocean started to melt. Indeed, the areas in the Arctic Ocean where the high methane releases occurred on January 14, 2014 (top image) show several practical salinity units (psu) increase since October 1, 2013.

Higher salinity levels are showing up closer to the faultline that runs through the Arctic Ocean from the top of Greenland to the Laptev Sea.


Quantities

These high levels of methane showing up over the Arctic Ocean constitute only part of the methane that did escape from the seafloor of the Arctic Ocean. Where these high concentrations did show up, the ocean can be thousands of meters deep, giving microbes plenty of opportunity to decompose methane rising through the water first. Furthermore, the methane has to pass through sea ice that is now getting more than one meter thick in the area where these high levels of methane showed up on satellite records. In conclusion, the quantities of methane that were actually released from the seafloor must have been huge.

Importantly, these are not one-off releases, such as could be the case when hydrates get destabilized by an earthquake. As the Arctic-news blog has documented, high releases from the seafloor of the Arctic Ocean have been showing up persistently since early October 2013, i.e. 4½ months ago. This blog has warned about the threat for years. This blog has also described in detail the mechanisms that are causing these releases and the unfolding climate catastrophe that looks set to become more devastating every year. The poster below illustrates the danger.

[ click on image to enlarge - note that this is a 4.9 MB file that may take some time to fully load ]
Impacts and Response

Huge releases from the seafloor of the Arctic Ocean have occurred persistently since early October 2013, even when releases like this may show up for one day in one area without showing up in that same area the next day on satellite images.

This apparent 'disappearance' can be due to the Coriolis effect that appears to move the methane, whereas it is in fact the Earth that is spinning underneath the methane. This doesn't mean that the methane had disappeared. Actually, much of this methane will persist over the Arctic for many years to come and will continue to exercize its very high initial warming potential over the Arctic for years.

Furthermore, even if less methane may show up on satellite images the next day, that doesn't necessarily mean that releases from the seafloor has stopped. Instead, it looks like methane is being released continuously from destabilizing hydrates. The methane may accumulate underneath the sea ice for some time, to burst through at a moment when fractures or ruptures occur in the sea ice, due to changes in wind and wave height.

Methane released from the Arctic Ocean seafloor has contributed to high surface temperature anomalies over the Arctic Ocean in a number of ways. As a potent greenhouse gas, methane is trapping heat that would otherwise radiate into space. Furthermore, methane rising through the sea ice reduces growth of the sea ice.


The danger is that methane will further warm up the air over the Arctic, causing further weakening of the Jet Stream and further extreme weather events, particularly extreme warming of water all the way along the path of the Gulf Stream from the Atlantic Ocean into the Arctic Ocean, in turn triggering further releases from hydrates at the seafloor of the Arctic Ocean and escalating into runaway global warming. This threat calls for comprehensive and effective action, such as described at the ClimatePlan blog.


Sabtu, 08 Februari 2014

CO2 growth highest on record

Despite many promises, global emissions of carbon dioxide (CO2) continue to grow.

NOAA figures show that 2013 CO2 level growth was the highest ever recorded, i.e. 2.95 ppm.

The EPA expects U.S. 2013 energy-related CO2 emissions to be 2% higher than in 2012.

The UC San Diego image below shows CO2 levels in the atmosphere over the past two years.

Back in September 2013, John Davies warned: The world is probably at the start of a Runaway Greenhouse Event which will end most human life on Earth before 2040. This will occur because of a massive and rapid increase in the carbon dioxide concentration in the air which has just accelerated significantly. The increasing Greenhouse Gas concentration, the gases which cause Global Warming, will very soon cause a rapid warming of the global climate and a chaotic climate.

The post featured a graph with a 4th-order polynomial trendline pointing at some 7.5 ppm CO2 annual growth by 2040. While many welcomed the warning contained in the graph, some argued against using higher-order polynomial trendlines. So, for those who don't feel comfortable with a 4th-order polynomial trendline, the graph below adds both a linear trendline and a 3rd-order polynomial trendline.


The 3rd-order polynomial trendline, based on the recent data, points at CO2 annual growth of some 7 ppm by 2040, justifying the warning sounded by the 2013 graph.

And what do the recent data say, when a 4th-order polynomial trendline is applied? As the image below shows, they show an even steeper rise, reaching 7 ppm growth per year as early as 2030.


As many posts at this blog have warned, rapid growth in greenhouse gases and numerous feedbacks are threatening to push Earth into runaway global warming. This calls for comprehensive and effective action to - among other things - reduce atmospheric CO2 levels back to 280 ppm, as illustrated by the image below and as further discussed at the Climate Plan blog.